Case Study - Portland
Joey Williams • May 16, 2019
City | Aging population, housing state of emergency since 2015, gentrification, 17.8% below poverty
Rainfall | 35.98 in
Elevation |
157 ft
Temp | 36 Jan 81 July
Biome | Warm temperate moist forest
Ecoregion | Willamette Valley
Extreme Events |
Urban flooding, extreme heat
Largely known for its lush canopy and robust sustainability efforts, Portland, Oregon has been planning for climate action since 1993. In the summer of 2015, CAPA was able to assess the effects of these efforts, and in 2018 published findings on how these effects are distributed alongside socio-economic status. This resulted in clear, actionable areas for climate planning moving forward.
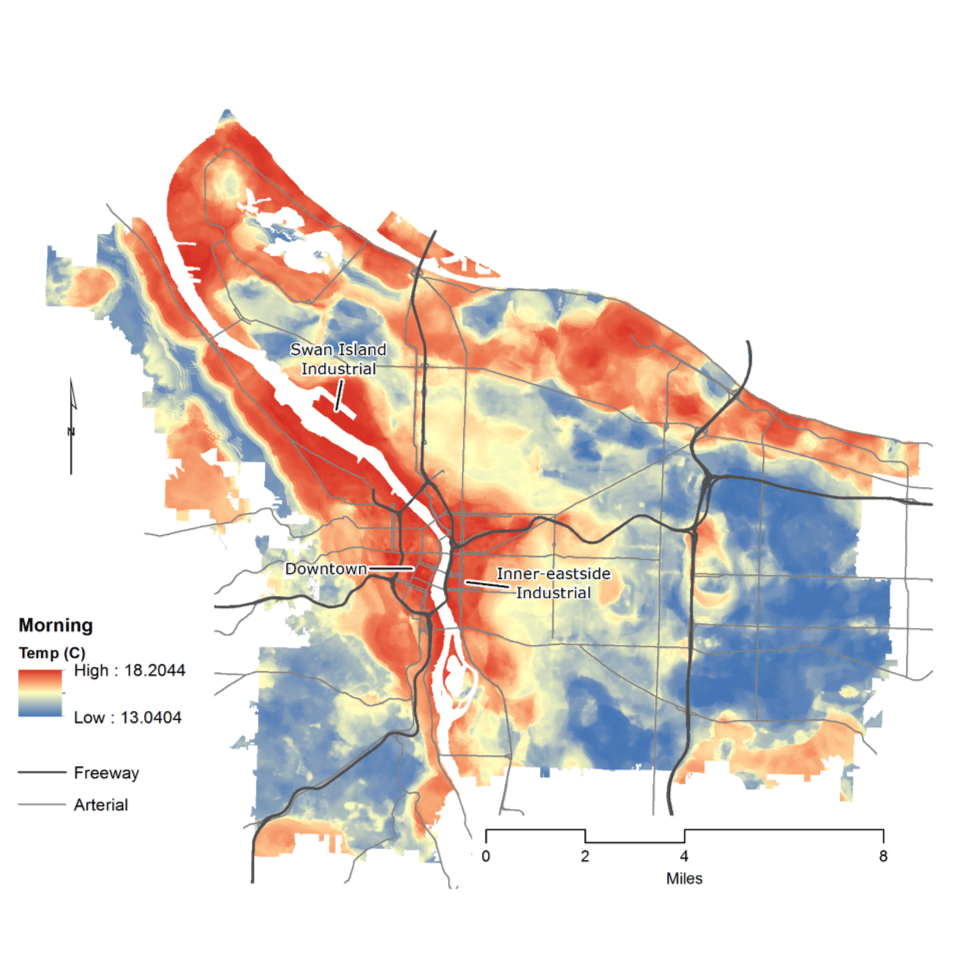
It’s clear Portland’s tree-lined neighborhoods have a strong effect on heat. While the shaded West Hills area felt the strong morning sun on that summer day in 2015, as the hours passed the area cooled off comfortably. This area also happens to be one of the city’s wealthiest.
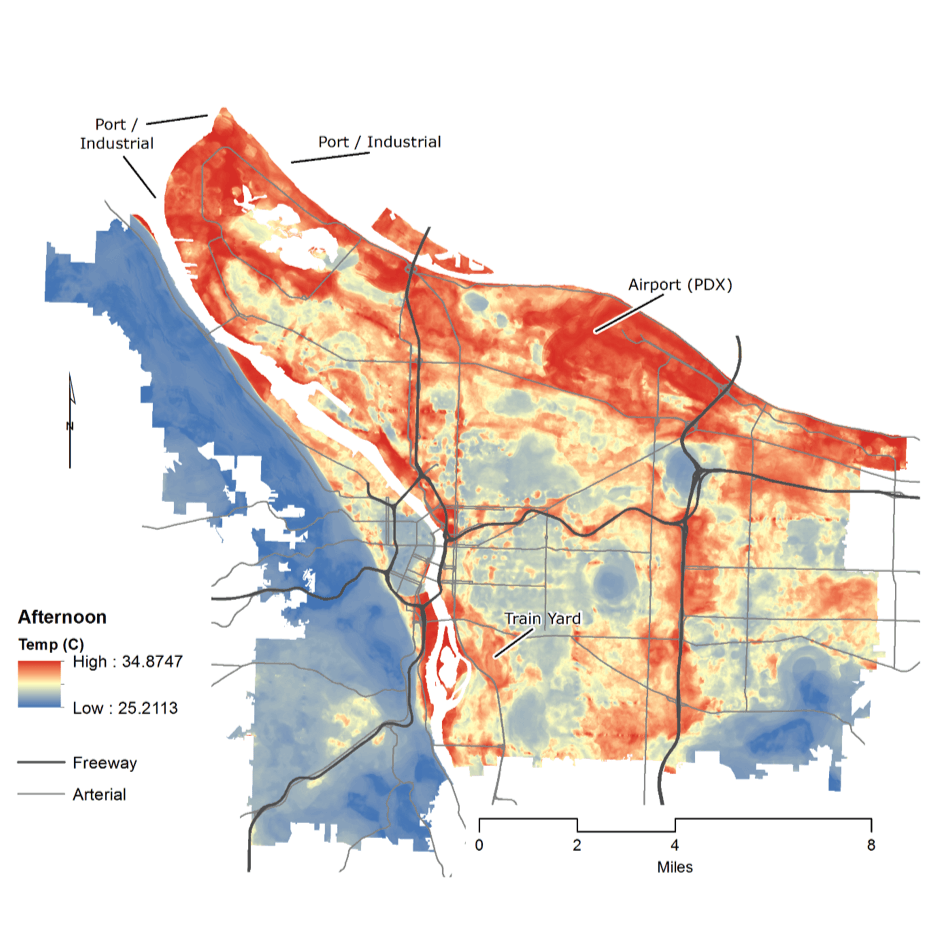
On the same day, other parts of the city such as the asphalt-covered airport were as much as fifteen degrees warmer.
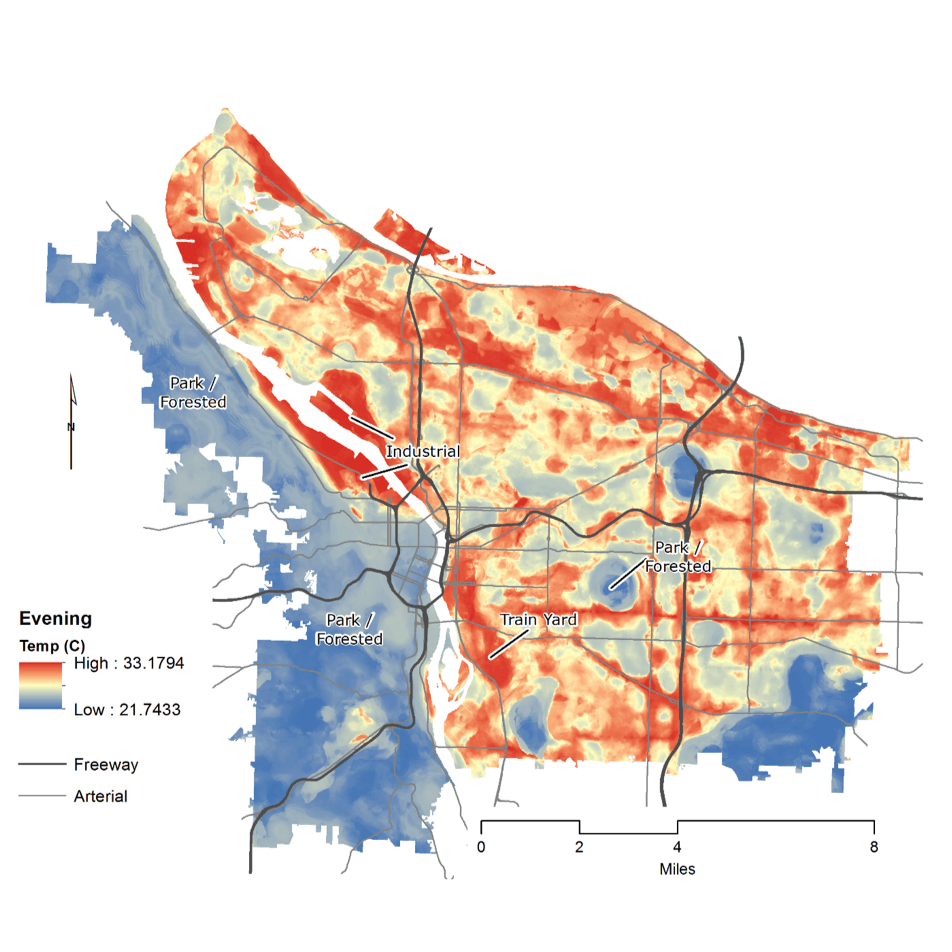
Travel east where both rents and canopy cover are significantly lower, and the effect on temperature in the city is equally intuitive. Automotive thoroughfares and large blocks of commercial developments get hot and stay hot. Newer developments with unestablished trees or increased hardscapes retain heat long into the evening. This means that those that already have to live farther away from the city center due to affordability also need to pay more for cooling costs, and this can have an effect on health.
Citywide, study results show significant relationships between heat exposure and populations that are low-income, non-white, minimally-educated, or poor English speakers; all of these socio-demographic groups, as well as those living in affordable housing, experience higher temperatures than their wealthy, white, educated, English-speaking counterparts. Fortunately, the isolated elderly – one of the highest-risk groups for heat exposure – did not significantly correlate with higher temperature areas.
Portland has an established network of public cooling centers for those that do not have sufficient cooling in their homes – a particular necessity for families with young children, who were found to be the least likely to have air conditioning units. These cooling centers, however, are most numerous in North and Northeast Portland, while the farthest eastern and western regions of the city offer fewer options for public refuge. Of all demographic groups, Asians and the elderly have the lowest accessibility to public heat refuges, whereas black populations have the highest access.
This research gives a clear direction for where future climate adaptation efforts need to be made to resolve the inequities of current heat distribution, and provides solid evidence for why these actions are so important. We are excited to continue working in the City of Roses to affect positive change for those most affected by urban heat, and to be able to see as well as feel the effects of our city’s efforts in the future.
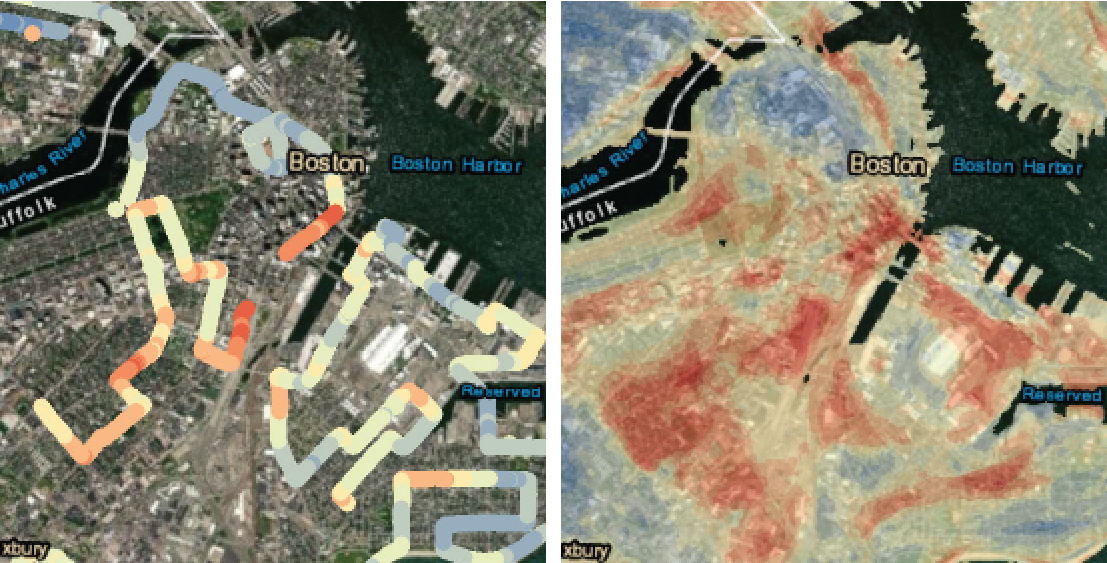
NOAA recently reported that July 2020 was the hottest on record in the Northern Hemisphere and the second hottest on record globally, with August likely not straying far from this pattern. Higher temperatures create a stronger signal for urban heat island mappers, so this has been good news for the 2020 cohort of urban heat mapping partners. All cities successfully completed their campaigns by mid-August. Together, the 2020 cohort engaged over 600 volunteers around the country, gathering over a million unique measurements of ambient temperature and humidity on high-heat campaign days, and helping to deepen and expand local and national partnerships for climate action. So, what now? What happens with these data, how are the maps created, and when will they become available? For the next several months, CAPA Heat Watch analysts will be actively poring over the datasets. The first step is to corroborate the collected data with campaign field notes. What were the weather conditions? Did all the volunteers show up and on time? Was the campaign completed in one day or several? Did the traverse end early due to rain or other unexpected events? Community science is replete with surprises, and sussing out specifics of campaign experiences is essential for understanding how the collected data relate to the experiment design. While most traverses come with no issues, others face the unexpected challenges of detours, low-hanging tree branches, minor sensor malfunction, and inclement weather. Debrief meetings between CAPA and campaign organizers, held soon after each campaign, help to ensure such details are understood and addressed during the data analysis process. A second step in ensuring high-quality results is the careful review of collected data from each traverse period, day, and location. CAPA analysts use a “filtering process” that applies quality control measures for refining the temperature and humidity data and removing any anomalies, outliers, and errors that are found. Next, using a spatial analysis platform, these “clean” data are then integrated with high-resolution (10 m per pixel) satellite imagery that help to describe the surrounding land use and land cover (LULC) of each data point. Fifteen concentric rings or “buffers” of different radii and ten unique spectral bands of satellite imagery are then combined and examined to determine the most influential LULC variable to each measurement. A machine-learning algorithm then uses these variables to predict temperature and humidity cell-by-cell across the study area at each independent traverse period. Figure in header: Traverse points (left) and predictive surface models (right) collected in Boston, MA, Summer 2019. Because each campaign produces between tens of thousands and hundreds of thousands of measurements, this robust approach allows analysts to use combinations of LULC to predict temperatures and humidity even in parts of the study area where volunteers did not collect data, or where data may be missing. Important to note is that this approach of examining surrounding LULC data is different from other methods of creating continuous surfaces with individual data points -- most notably interpolation -- which generally rely only on differences in adjacent measurements to make temperature predictions in between. Research has shown interpolation produces results that don’t match well with real-world observations whereas the machine learning and model-based approach used by CAPA has been validated by in situ observations. Given no significant challenges during data cleaning, integration, or the analysis process, a total of nine maps and datasets are typically produced for each study area -- three traverse point maps (morning, afternoon, and evening), and two continuous surface maps of temperature and heat index for each collection time. The resulting maps are studied by CAPA analysts together with other staff to validate the minimal data quality standards, which consist of accuracy, precision, relevance, and extent. The team scrutinizes each map for inconsistencies and anomalies; and, in some cases, may revise the maps as needed. Once the maps are validated and finalized, the CAPA team generates a statistical summary and integrates all of the maps into a final report that also includes stories and photos from the campaign, methodology, observations, and suggestions. Along with the final report, local organizers will receive the cleaned data vector files and rasters, and access to an interactive online map that displays the maps. Once local organizers have had a few weeks to review the maps and share the report with their volunteers, CAPA staff will offer an opportunity to discuss observations and solicit feedback, which will also be available through an online survey to all participants. We at CAPA look forward to hearing your views and feedback on the campaign process and results!

Around the world, people adapt to extreme heat through a deep understanding of place, whether it's finding a shady refuge outside, innovating indoor cooling systems, or enjoying cold food and drinks. In order to continue through a pandemic, global civic unrest, and the height of a natural disaster season exacerbated by climate change, it is essential to be able to function on extremely hot days in our human bodies in order to grapple with the larger demands we are facing. In this spirit, CAPA Strategies staff member Thea Kindschuh shares her own and others’ personal stories about how they are coping with heat through their own day-to-day adaptations in their respective corners of the world. Thea Kindschuh, 28, has never lived in a home with air conditioning. Growing up in Portland, Oregon, she remembers the daily ritual of closing all the doors and shades during the day and opening everything up as soon as it was cooler outside than in. If she couldn’t get up into the mountains or to a nearby swimming hole, she and her siblings would spend the hottest days eating popsicles in the basement. They had an enormous industrial fan that her father must have picked up from an old office space in the 80s. It would roar in the front door as it blew cool night air into their house, and her mother would bring them wet washcloths for their foreheads when they went to bed. On the high desert mesa of Taos, NM, where she currently lives, many of these techniques still apply. She uses curtains to block out as much sun as possible from the house during the day and opens the cooling tubes built into her home to passively bring air cooled from the ground through the house. Because her home runs on solar energy, she tries to minimize electricity use during the day to be able to keep a fan running through the night. Cooking appliances are used minimally to keep the space cool, but options like sun tea and cold brew coffee are wonderful alternatives. Tea and coffee are dehydrating, however. For a rehydrating beverage, she likes to dissolve honey, lemon juice, and a pinch of salt in hot water and dilute with cold to taste. “Always layers, and always wear a hat.” - Nancy Ryan, pictured, outside her wood and adobe home. In the neighboring Taos mesa community of Tres Orejas, Nancy Ryan, 86, has the heat and air movement in her oddly-shaped octagonal house down to an art form. She keeps open pathways along the ground from the portable "swamp cooler" in the front room (Nancy has a store-bought system, but you can also make your own ) through to her bedroom, and stays largely in the low parts of the house where the cool air pools. The windows are covered with insulating fabric during sunny hours, and she watches the sun across the mesa for when to open which windows to maximize cool air flow. She is careful to ensure she has drinking water, full oxygen tanks, and gas in the generator in case they don’t get enough solar power to keep her partner’s CPAP machine running through the night, which has been needed more often as the angle of the late summer sun has combined with forest fire smoke to reduce their usual solar gain. Shakir’s son Sahib, 12, pictured in the header enjoying a motorbike ride through the Himalayan foothills. A year ago, Shakir Lufti, 38, was able to move his family from their home in Delhi, India, to the mountain town of Dehradun, which is much cooler. In Delhi, he would fill a cooler with ice and water that would blow cool air into his home. They use large clay pots to keep drinking water cool, and now have refrigeration and enjoy plain yogurt on hot days. Shakir often takes motorbike rides through the mountains, and his children enjoy playing on their balcony or in local rivers. In Milan, Italy, Giorgio Olgiati, 26, says electricity is very expensive so many households don’t use air conditioning. The homes are often double-layered cement with an insulating natural-fiber material such as cellulose, wood fibers, or hemp or cork in between. On the hottest days, he uses a small portable fan in the room he’s using. Of course, Italian gelato is a summer staple and, according to Giorgio, every Italian household keeps a large stock of popsicles on hand. Free potable water fountains throughout the city help the public stay hydrated while moving about as well. Giuseppe Cilione, now 29, remembers growing up in the southern Italian region of Calabria. Before refrigeration was common, families would put their favorite summertime dolce of watermelon in either a cold mountain river or in a hole in the sand where the waves would keep it cool. In the countryside, farmers would opt for wool shirts over cotton year-round, as the material would insulate from both cold and heat. If you have a heat story you’d like to share, please reach out to us at info@capastrategies.com, or via social media @CAPA_HeatWatch on Instagram and Twitter.

Heat is the number-one weather-related killer, and in cities it’s even worse. Earlier this month a study collected 10,000 data points around the city of Cincinnati to determine which locations are hotter and which are cooler. They will use that information to keep people safe and move forward with development. “At its core this is a public-health safety issue,” City of Cincinnati Sustainability Coordinator Oliver Kroner said. A study funded by National Oceanic and Atmospheric Administration used street scientists to drive or bike around town to collect temperature data. These volunteers took the same route, three times in the same day: once in the morning, once in the afternoon and once in the evening. “During major heat events, people with asthma or respiratory issues can experience conditions that can threaten their life,” Kroner explained. “So we’re trying to understand where this is happening across Cincinnati, where these urban heat islands are being created by the design of our built environment. “We have what is called the Green Cincinnati Plan. It’s our playbook for addressing climate issues and for planning for the future. We anticipate hotter temperatures moving forward. So we can see, well, we have people living in these areas of extreme heat, what can we do about it?” Read the full article on FOX 19 Now >>