Health & Social Assessment
Characterize heat vulnerability through the lens of socio-demographic and health components. Understand the social composition of the areas most and least exposed to extreme heat to assist with prioritizing hazard adaptation activities.
Deliverable
Report detailing relationship between socio-demographics, health risk factors, and heat, spatial assets with metadata.
Process
Analyze the relationship between heat, socio-demographic data, and health indicators.
Impacts
Evidence base
Vulnerability insights
Response planning
Report Sample
(Click for high-resolution PDF)
Project Example
Dallas, TX

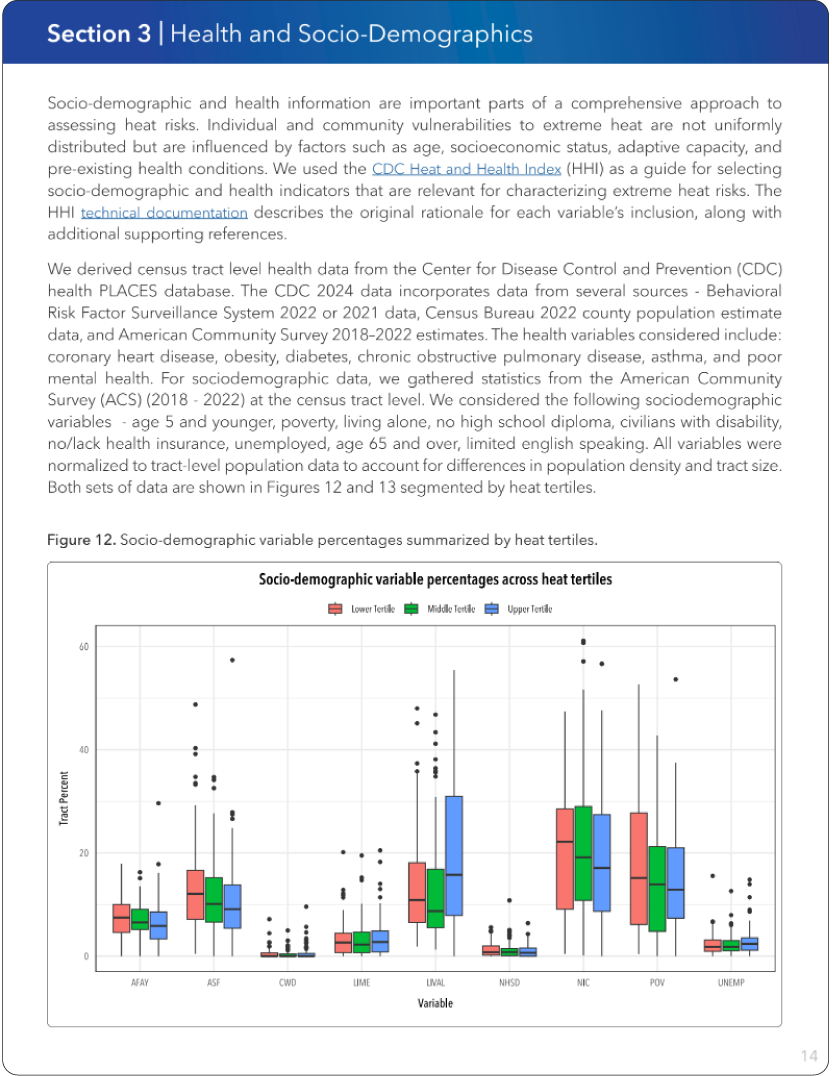
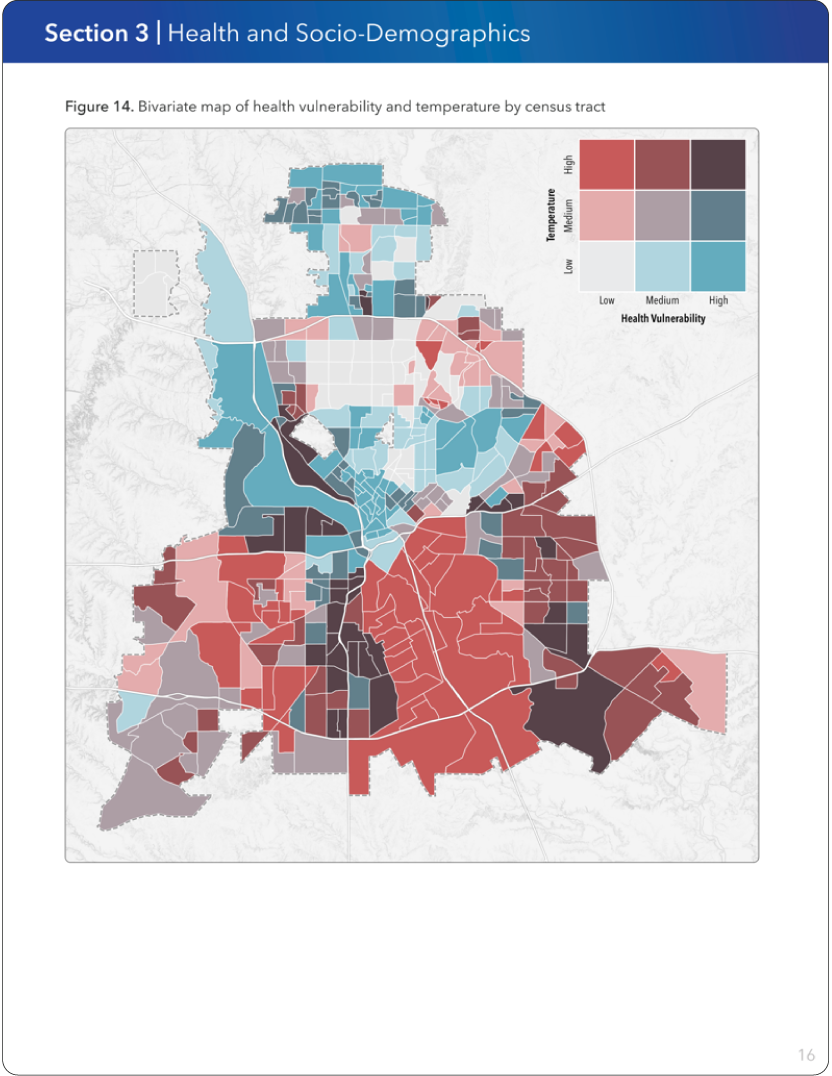
CAPA analyzed the relationship between two Heat Watch campaigns in Dallas Texas and CDC/Census heat vulnerability indicators at the census tract level. Health indicators included coronary heart disease, obesity, diabetes, chronic obstructive pulmonary disease, asthma, and poor mental health. Socio-demographic indicators included populations aged below 5/over 65, poverty, living alone, lack of high school diplomas, disabilities, no/lack health insurance, unemployment, and limited English proficiency. Findings showed distinct clusters of census tracts with high heat and high vulnerability and others with low heat and high vulnerability. Spatial assets of these data were provided to support future heat mitigation and adaptation planning activities.
Check Out Our Other Services


Air Quality Monitoring
Extreme Heat Projections
Intervention Guidebook