Extreme Heat Projections
Visualize the impacts of extreme heat in your area through 2100. Evaluate multiple scenarios for resilient extreme heat planning.
Deliverable
Report describing the future impacts of extreme heat, raster assets for projected heat scenarios, tabular data files with bias-corrected heat statistics.
Process
Analyze CMIP6 projections to evaluate future heat risks. Produce future Heat Watch scenarios if campaign data is available.
Impacts
Hazard Knowledge
Scenario Planning
Adaptation Insights
Project Example
Bloomington, Indiana
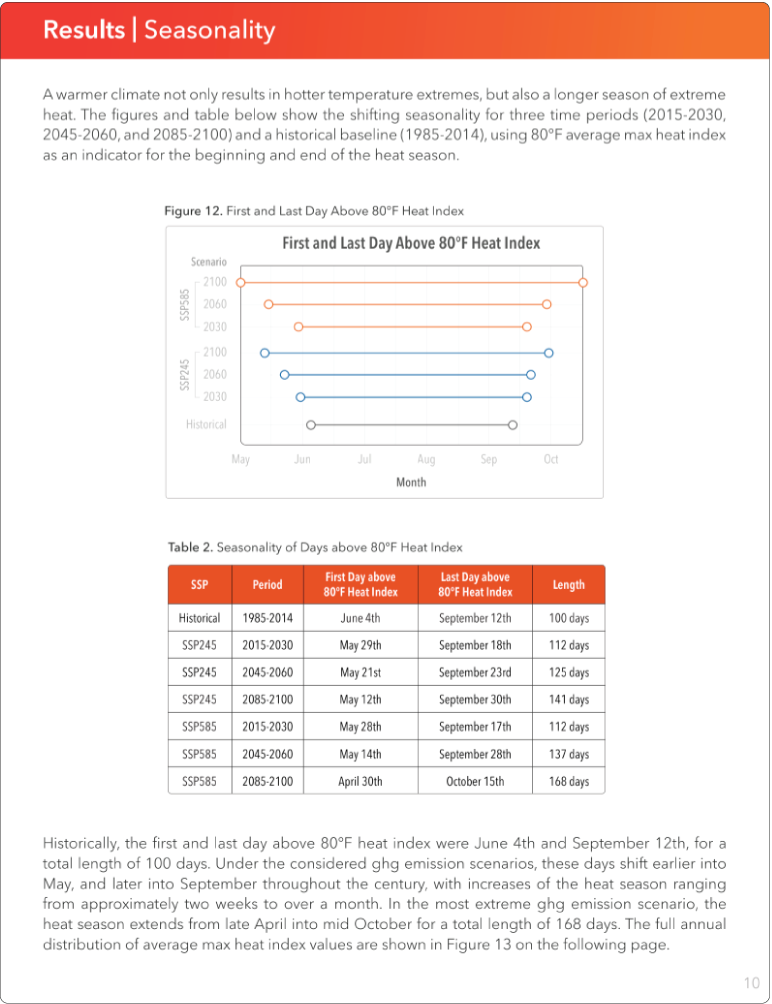
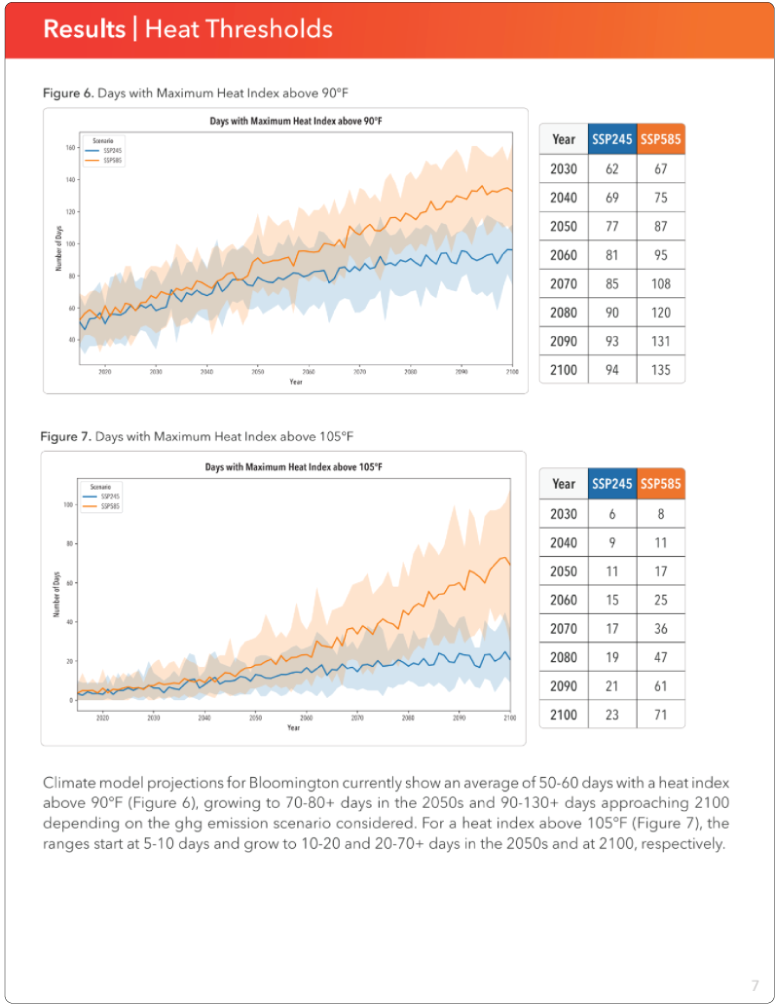
CAPA, in partnership with the City of Bloomington, collected data during the summer of 2024 Heat Watch campaign. To add to these findings with an assessment of future heat scenarios in Bloomington, CAPA performed a series of extreme heat projections with NASA’s Global Daily Downscaled CMIP6 Projections. Scenarios covered a moderate increase in atmospheric carbon (SSP245) and an extreme case (SSP585) with projections through 2100. Analysis components included future Heat Watch Projections, days exceeding maximum and minimum heat thresholds, changes in magnitude and duration of heat-wave conditions, and shifts in seasonality of extreme heat.
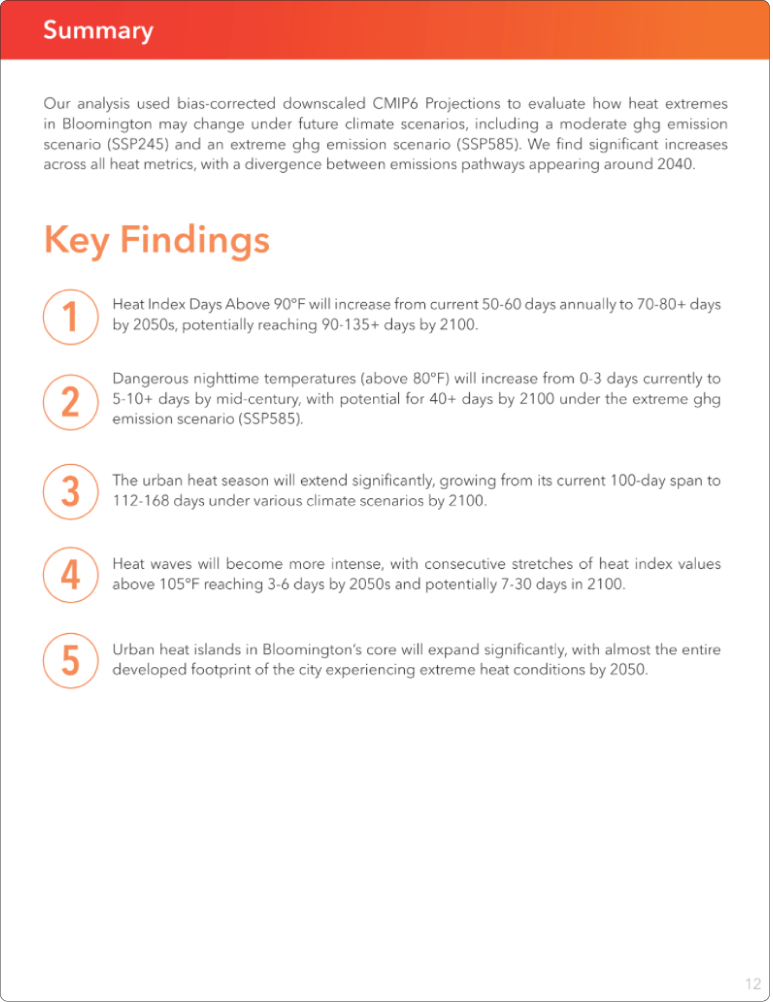
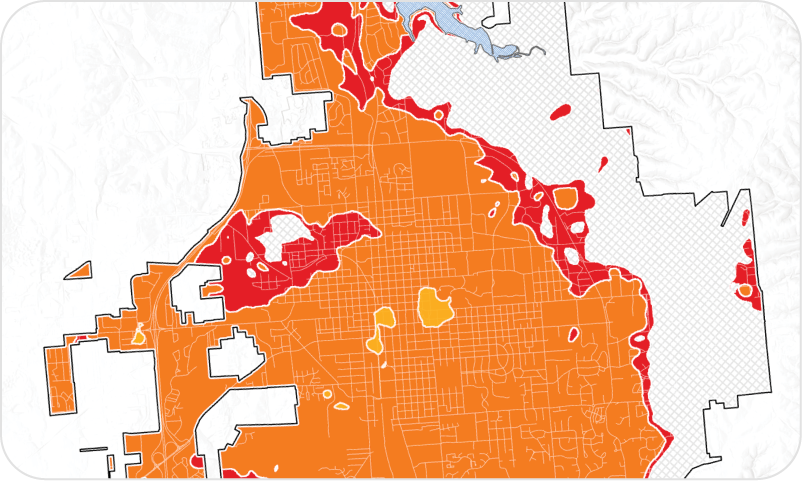
Key findings showed that Heat Index days above 90°F and days with dangerous nighttime temperatures (above 80°F) increased under both scenarios. The length of the heat season was also projected to extend with heat waves becoming longer and more intense. Findings showed that urban heat islands in Bloomington would expand significantly, with almost the entire developed footprint experiencing extreme heat conditions by 2050.
Check Out Our Other Services

Jurisdictional Scan
Health & Social Assessment

Community Cooling Solutions