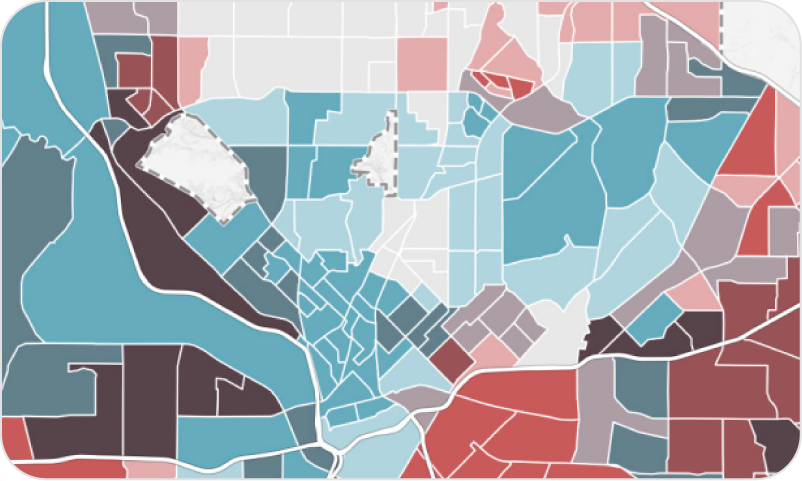
Air Quality Monitoring
Measure particulate matter (PM) concentrations through mobile and stationary monitoring approaches.
Identify pollution hot-spots and areas facing prolonged exposure to poor air quality.
Deliverable
Mobile and stationary AQ data and maps; summary report (PDF) with data visualizations and key findings
Process
Deploy mobile and stationary air quality sensors to measure PM2.5 and PM10 along mobile routes and places of interest.
Impacts
Assess Exposure
Build Awareness
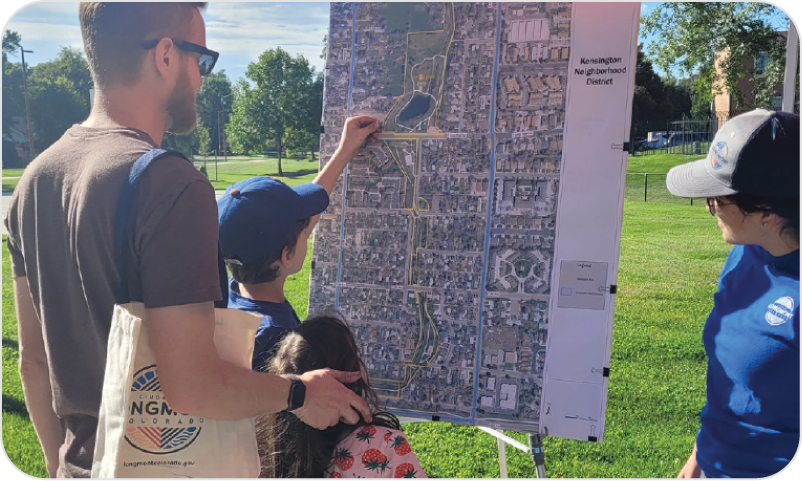
Engage Community
Report Sample
(Click for high-resolution PDF)
Project Example
Bloomington, Indiana

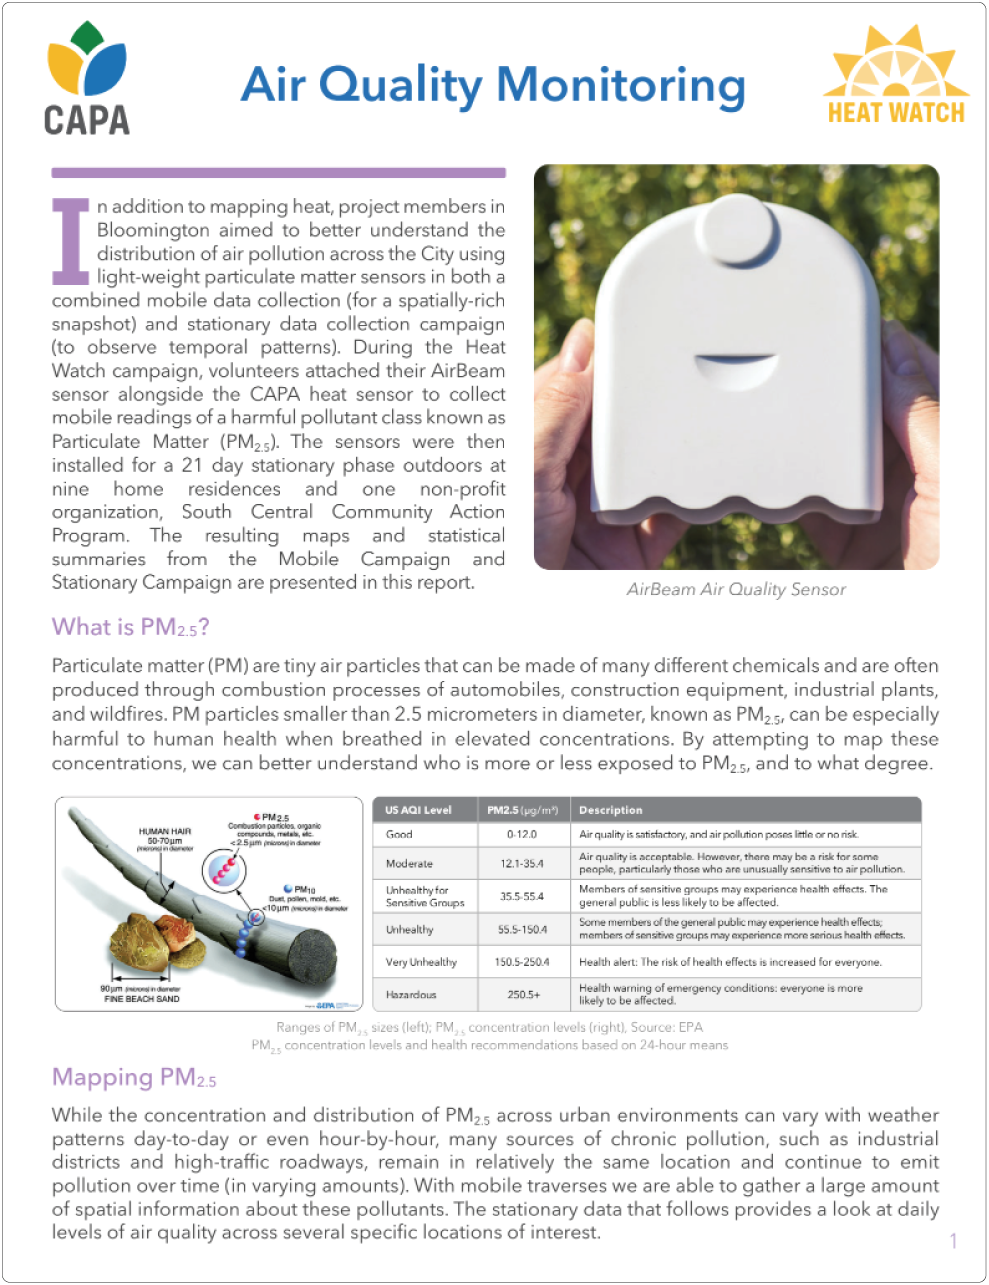
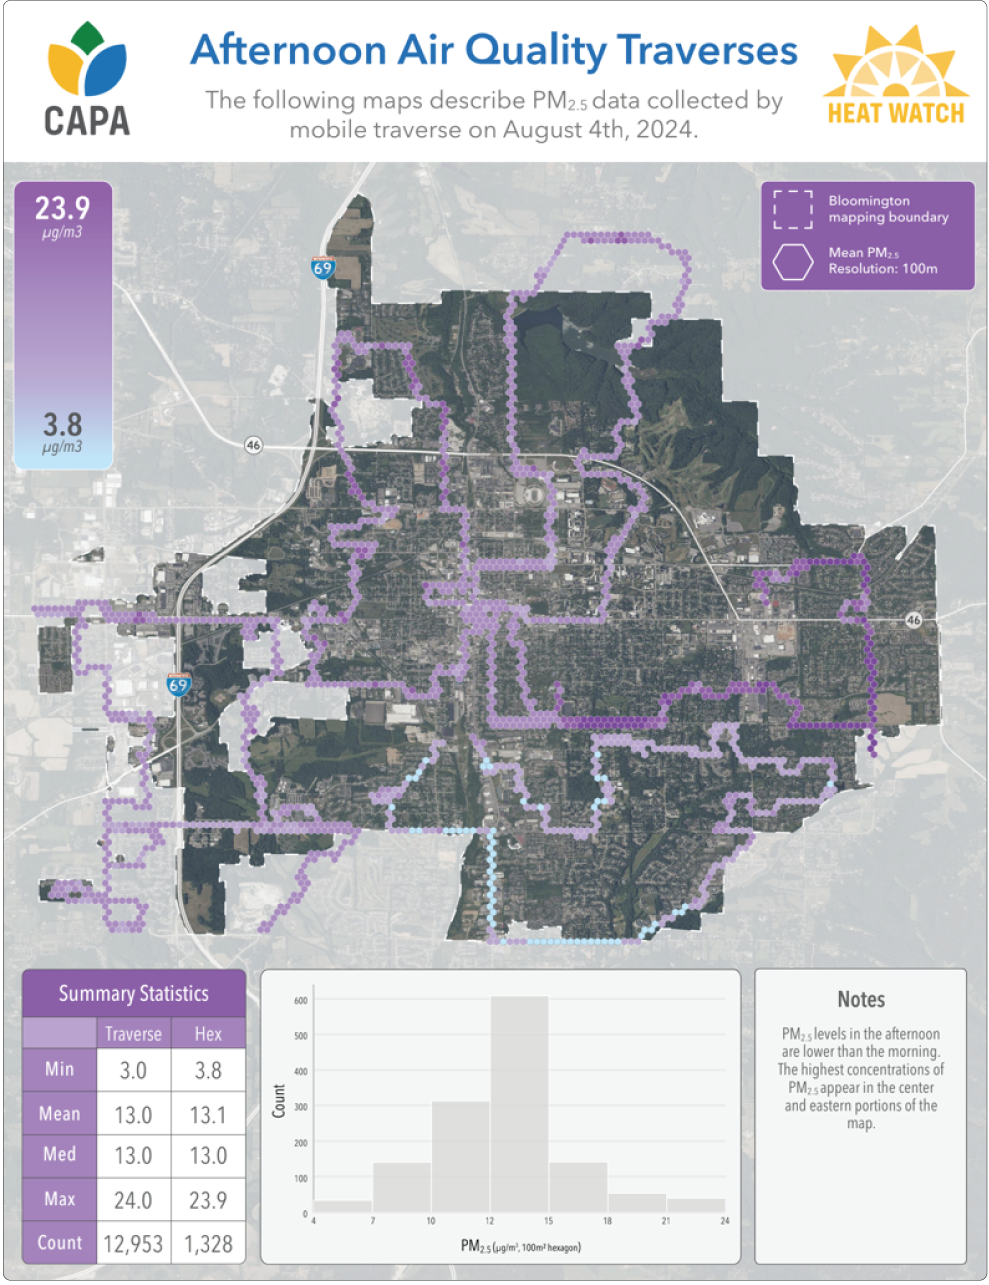
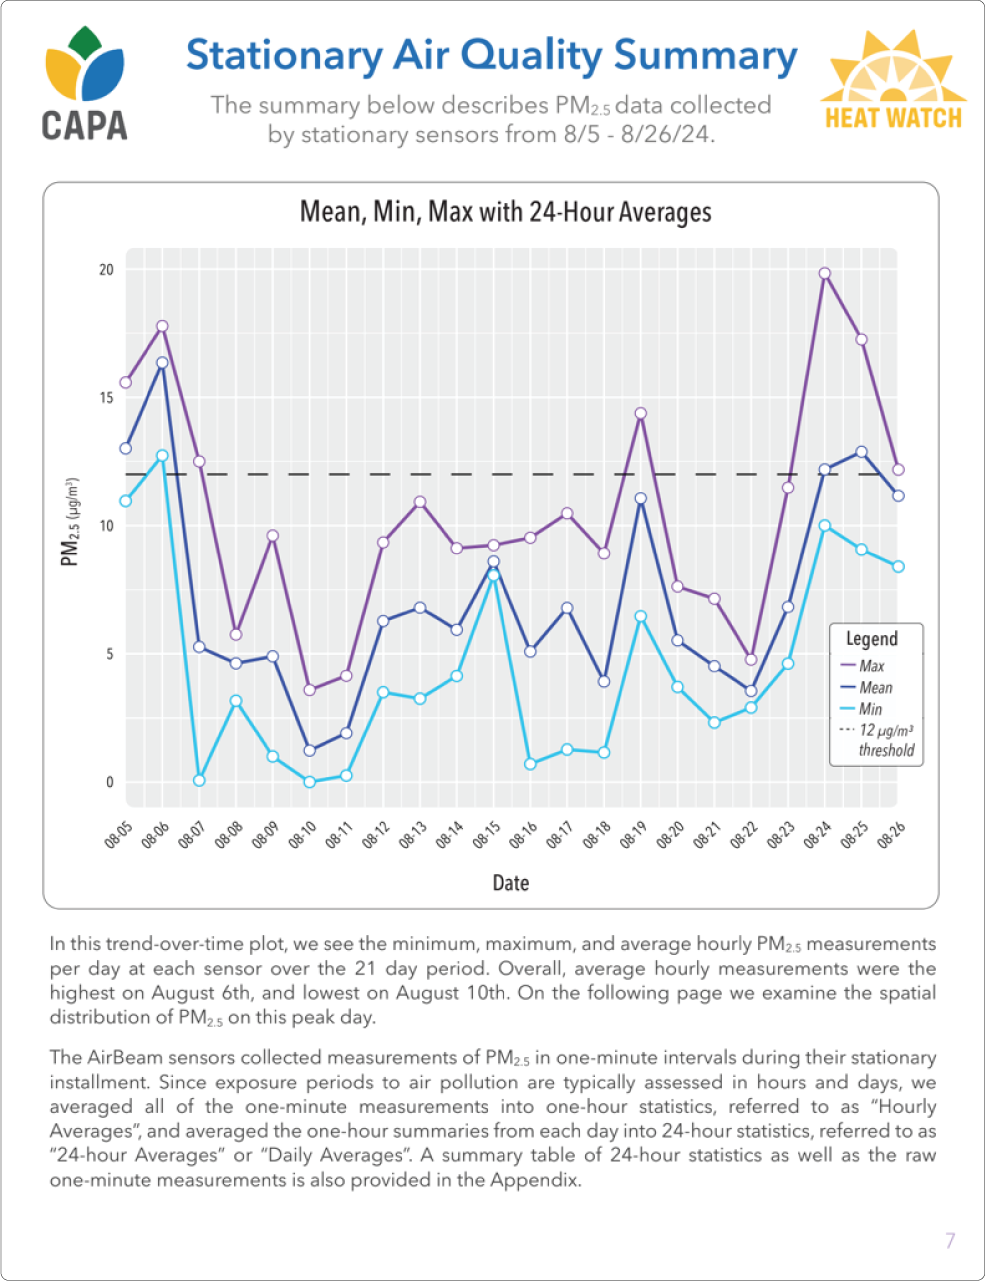
As an add-on to their Heat Watch campaign, CAPA setup air quality monitoring in Bloomington to better understand the distribution of particulate matter (PM2.5), a harmful pollutant that can affect community health. Using mobile sensors, Bloomington volunteers collected mobile data using vehicle-mounted sensors on August 4th, 2024, and also collected data in a 21-day stationary monitoring campaign from August 5th-26th, 2024 at ten diverse locations across the city. Our mobile mapping provided a spatial snapshot revealing significant PM2.5 variations, often observing higher concentrations of PM2.5 near the city center, especially during the morning hours. The supplementary stationary monitoring allowed us to track temporal air quality trends, identifying specific locations where PM2.5 levels exceeded EPA advisory thresholds for sensitive populations.
Check Out Our Other Services

Jurisdictional Scan
Health & Social Assessment
Community Cooling Solutions